1. Navigate to https://
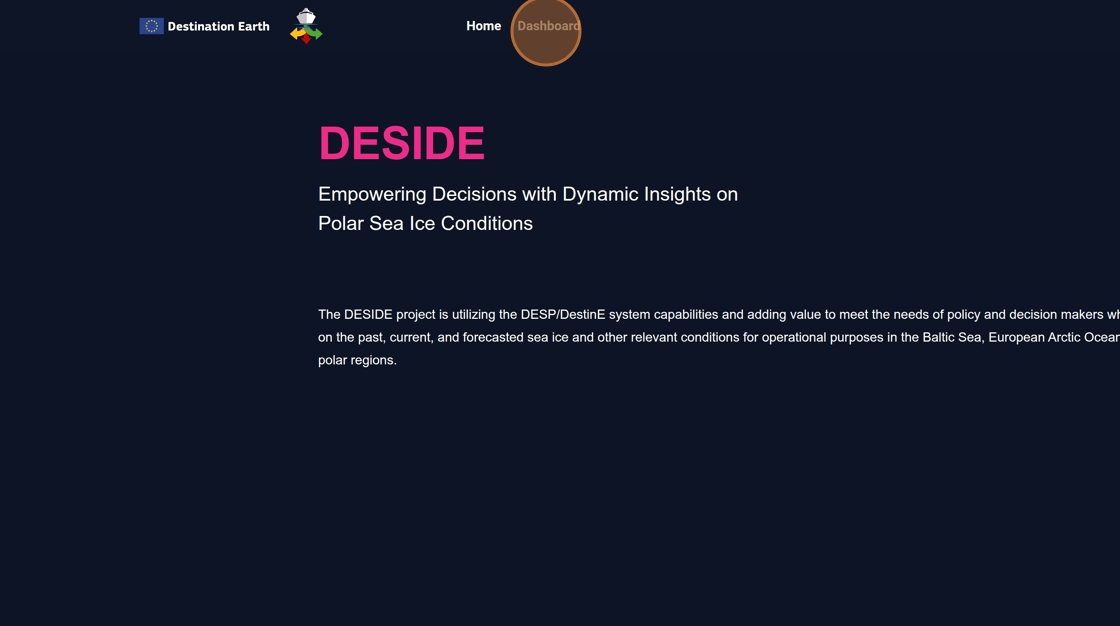
2. Click “Dashboard”
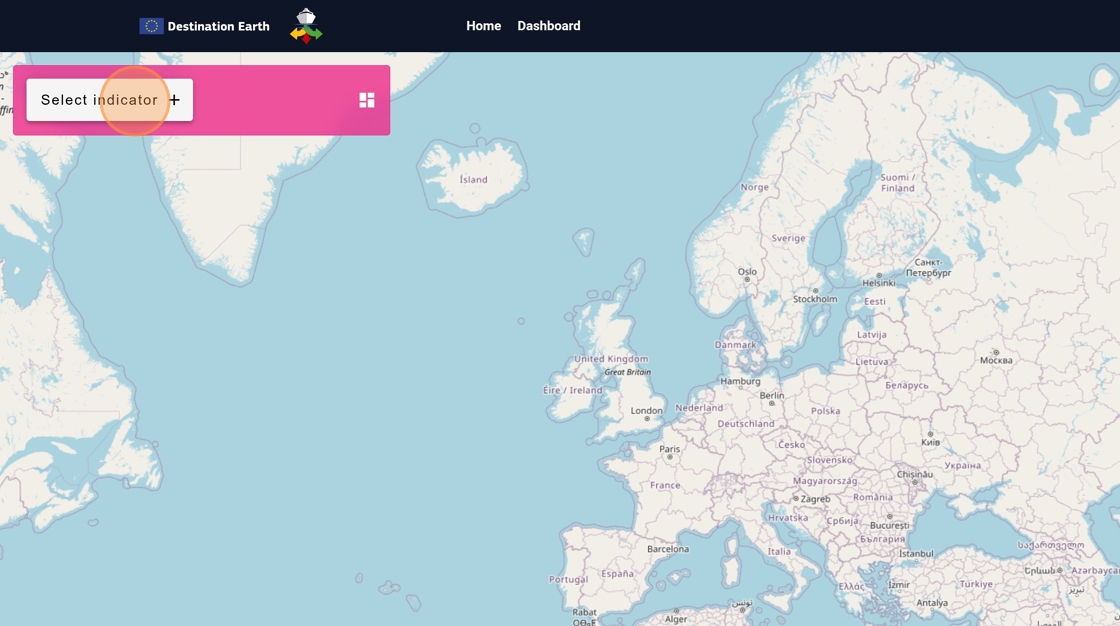
3. Click “Select indicator”
4. Click “POLARIS”
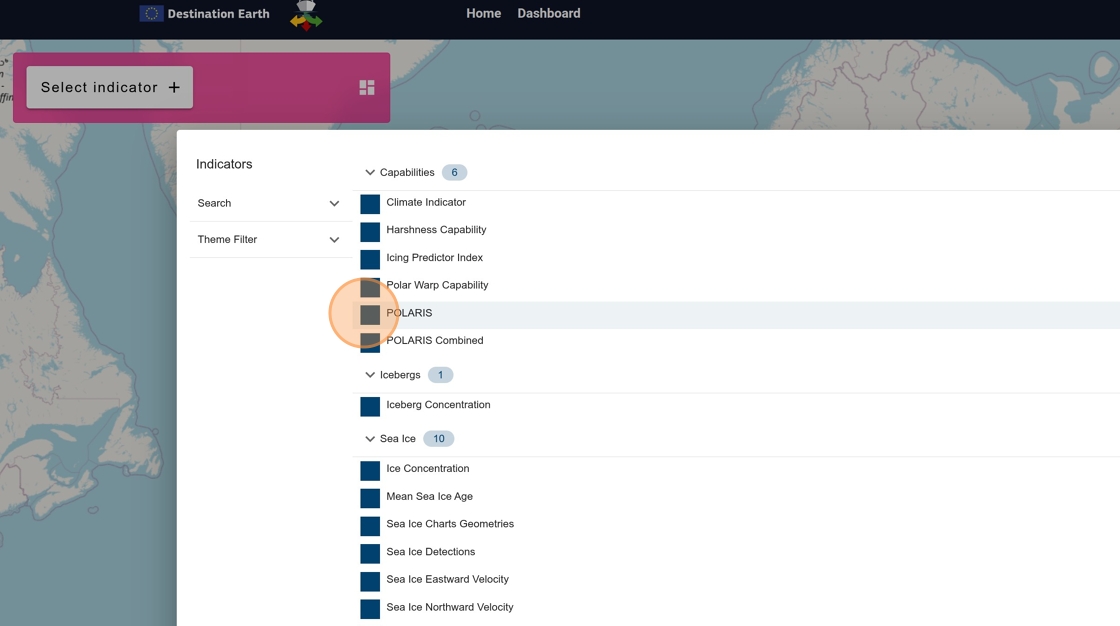
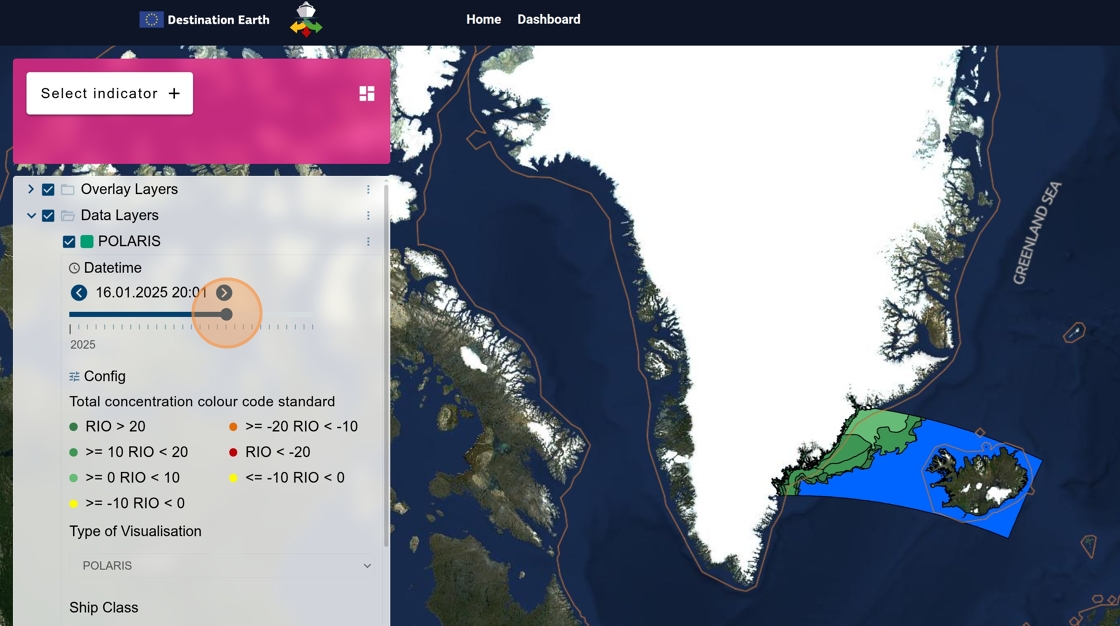
5. POLARIS options are displayed in the left panel
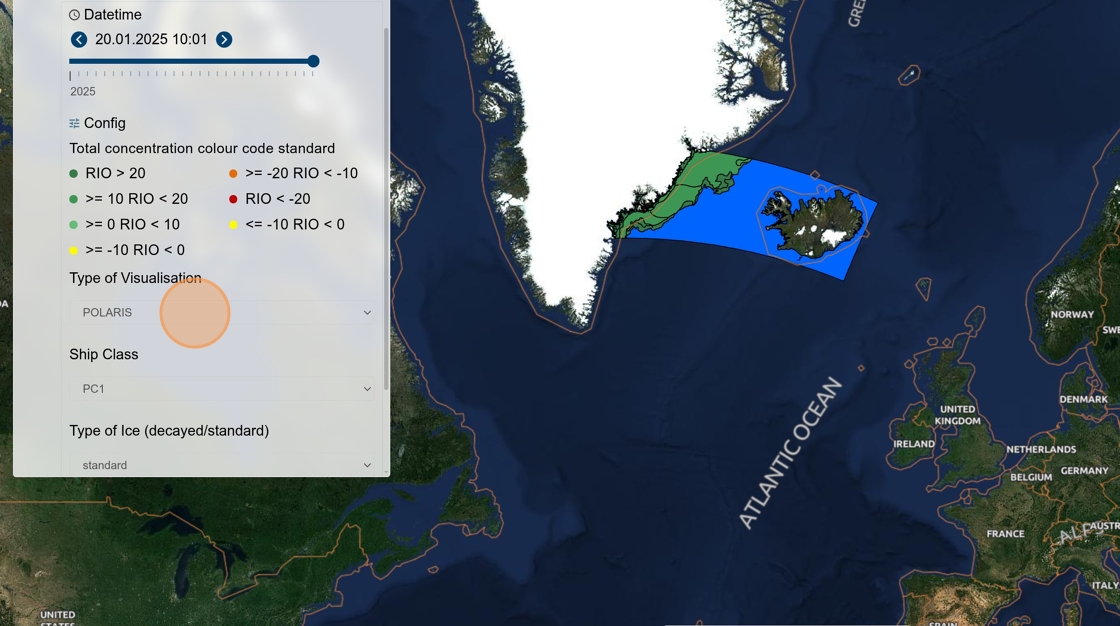
6. You can select Type of Visualization, Ship Class and Type of Ice
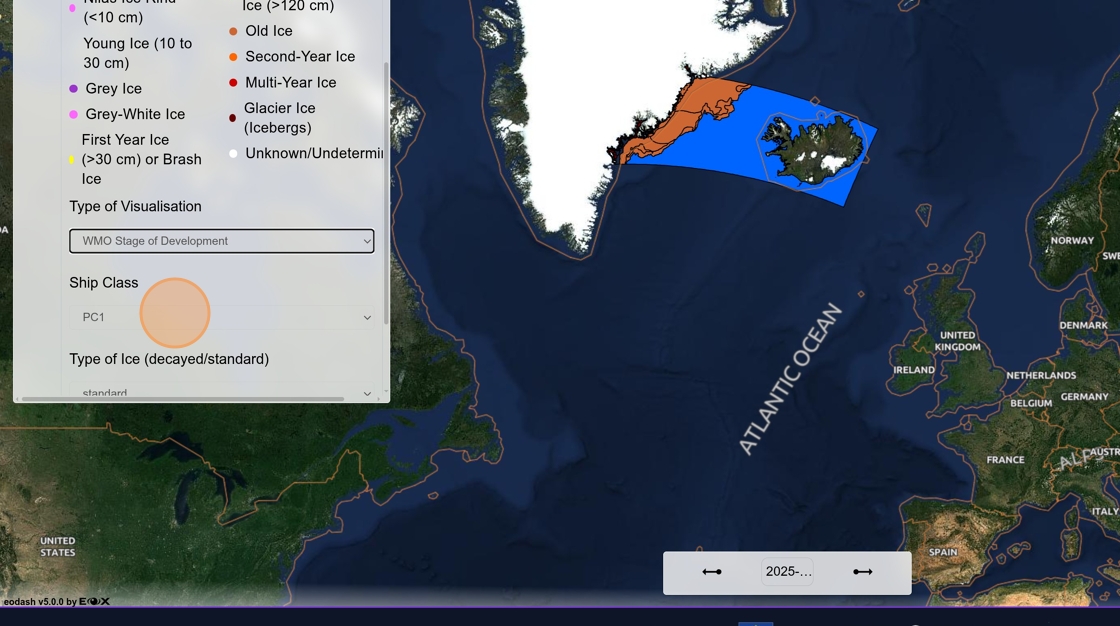
7. Additional information are displayed on mouse hover
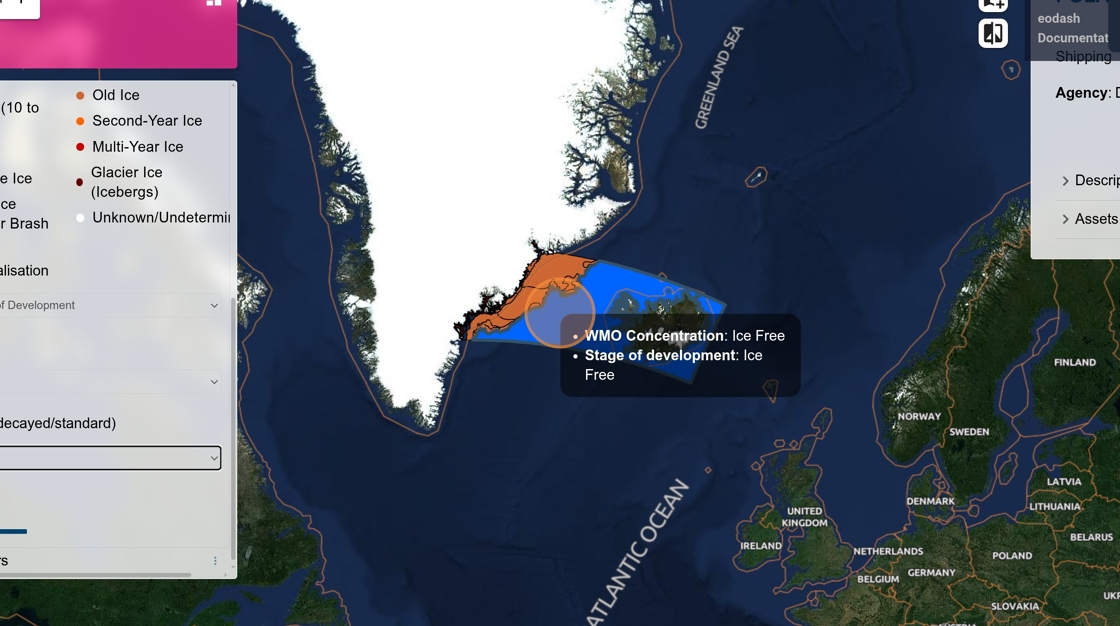
8. Different information is available for different visualization
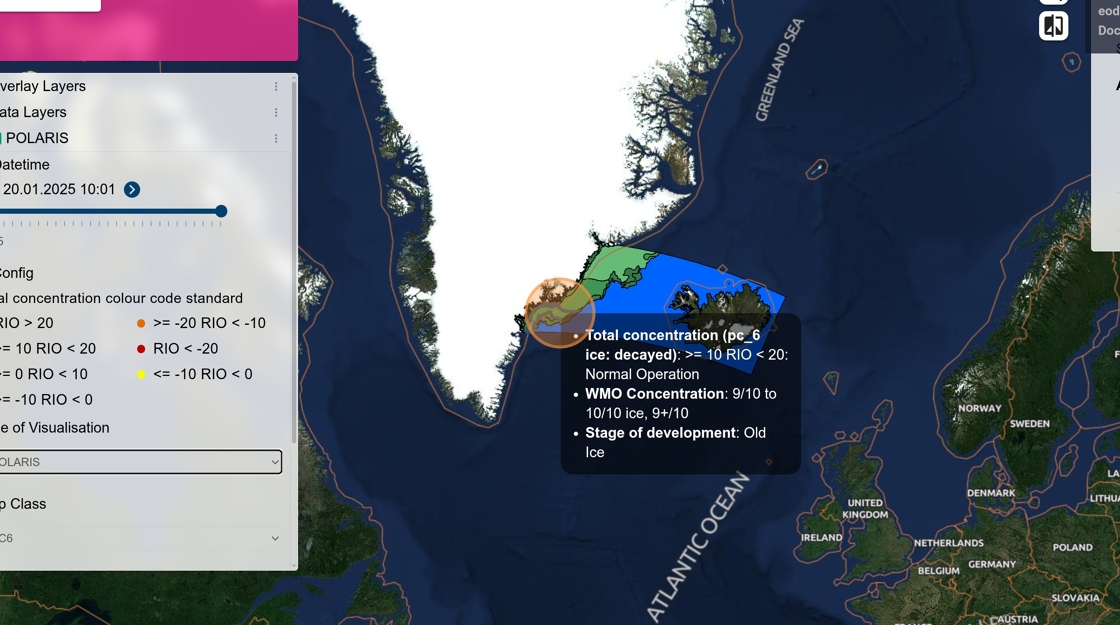
9. Date selection allows comparison