JupyterLab in the EOxHub Workspaces environment provides a flexible, browser-based interface for interactive computing, data analysis, and algorithm development. It is the primary workspace for working with Earth Observation (EO) data, executing Python code, and building reproducible workflows using Jupyter Notebooks.
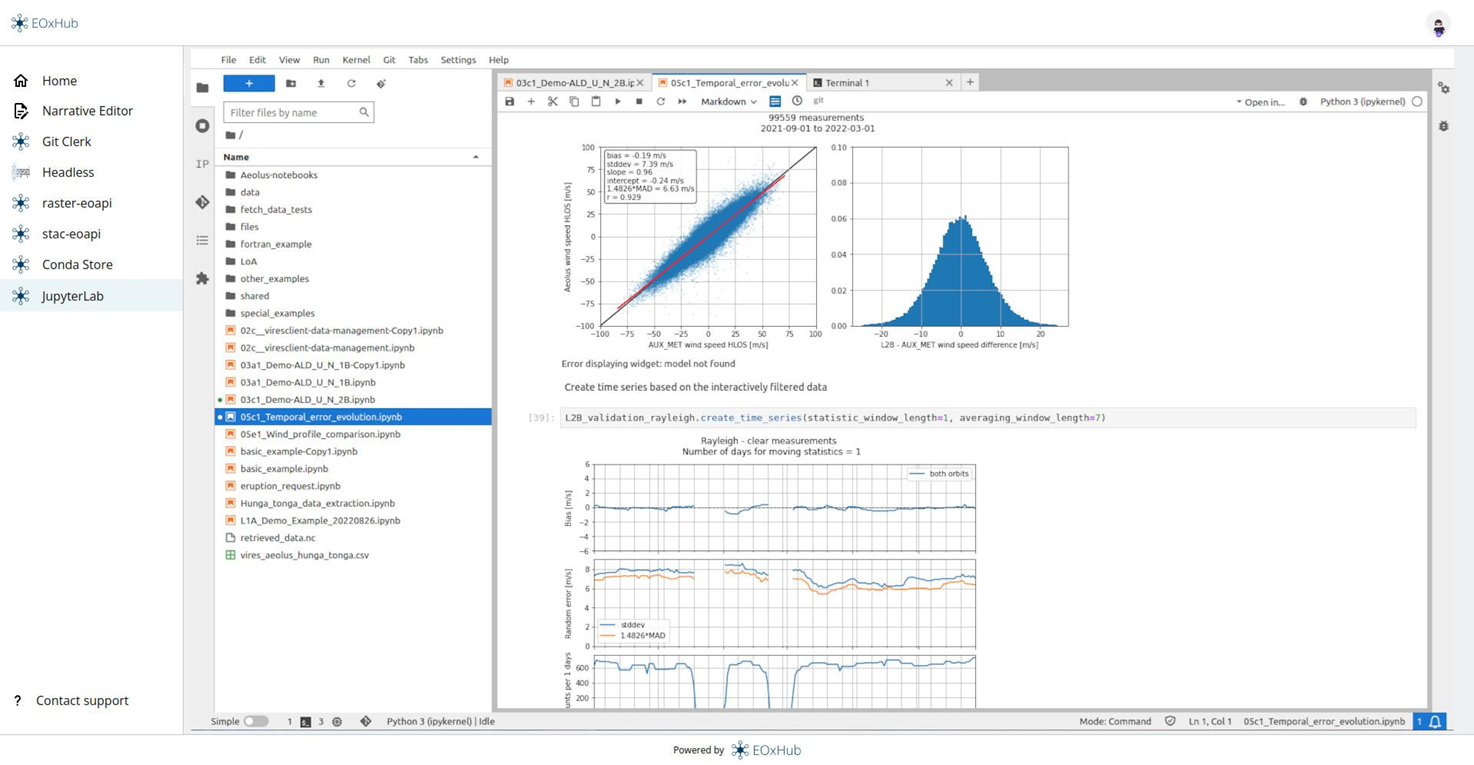
What is JupyterLab?
JupyterLab is a next-generation web-based user interface for Project Jupyter. It enables users to:
Write and run code in Jupyter Notebooks
Access a terminal and file browser
View and edit CSVs, images, and text files
Use drag-and-drop functionality across tabs
In the context of EOxHub Workspaces, JupyterLab comes pre-configured with common EO and geospatial libraries, making it ideal for analysis, visualization, and prototyping. For more information, please visit the official documentation
Starting with JupyterLab in EOxHub Workspaces
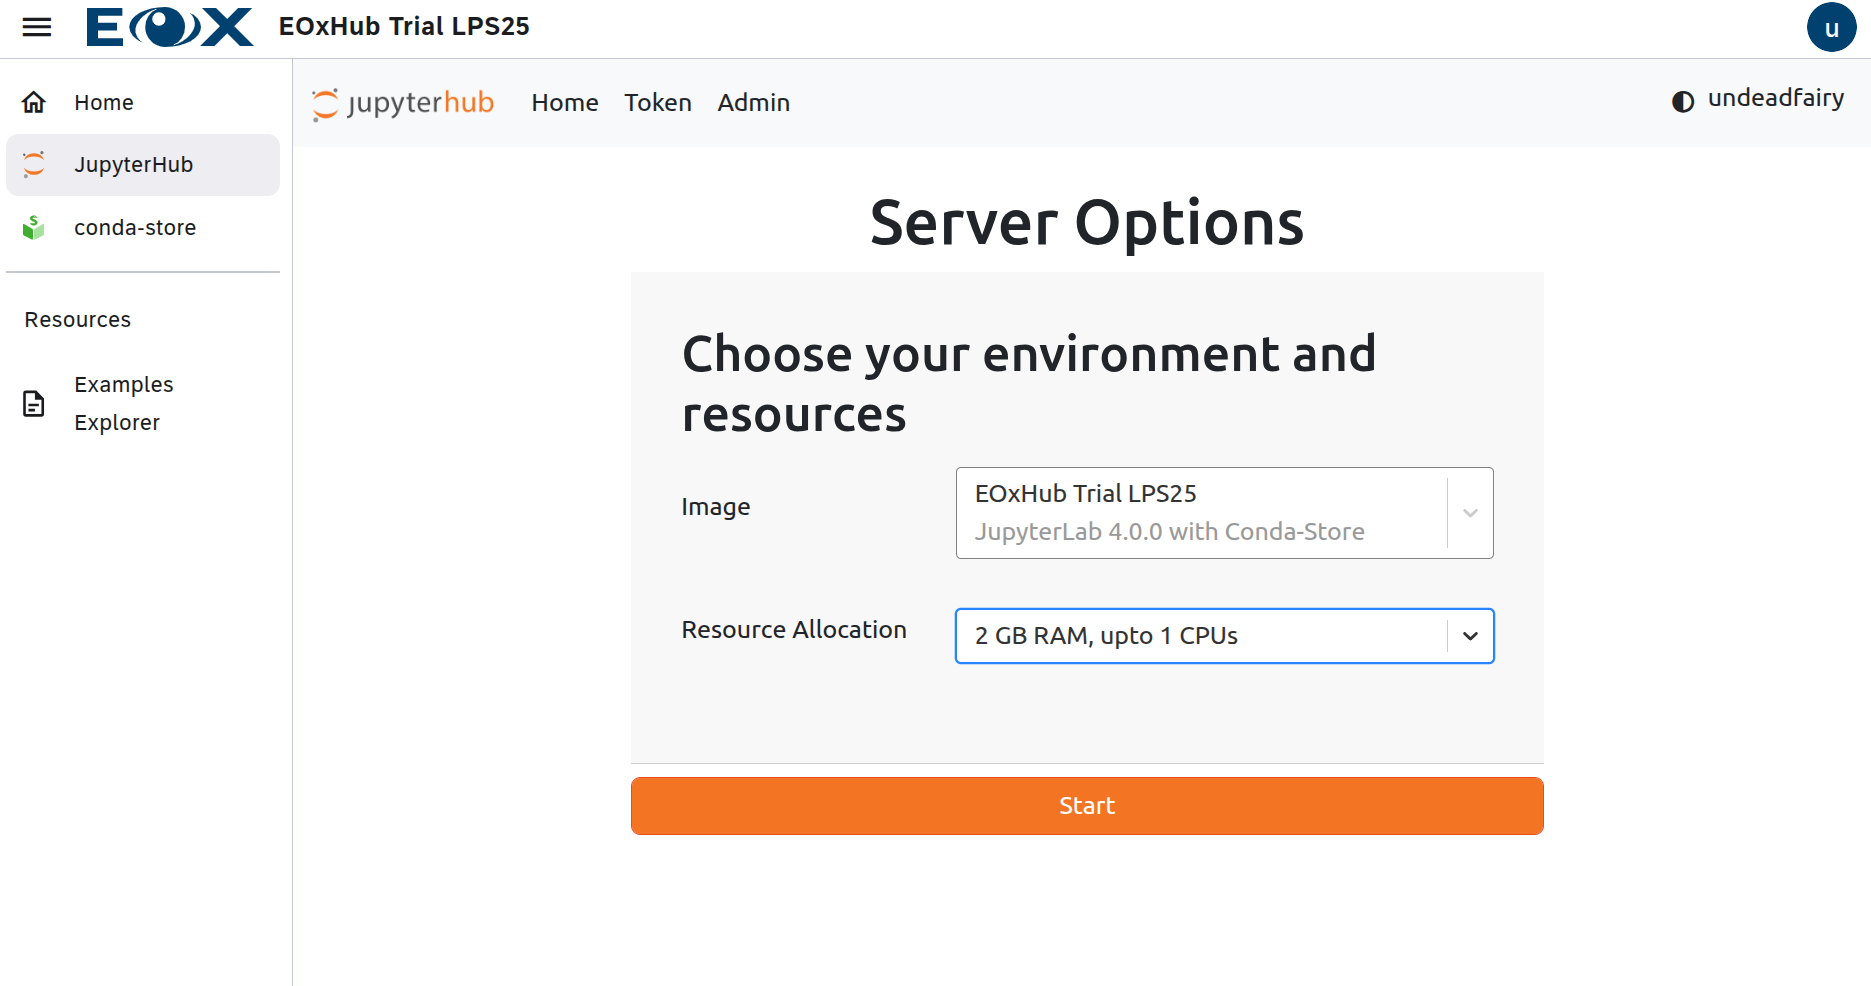
When launching JupyterLab in EOxHub, you will be asked to choose a user profile, which defines the computational resources available (RAM, CPU, and in some cases also disk space). This helps to tailor your session based on the workload.
These are examples of common profiles based on the chosen subscription plan:
Trial Profile: Ideal for lightweight exploration and testing, usually available in workshop settings or trials
Standard Profile: Recommended for moderate EO processing
Large Profile: For heavy workloads (model training, large-scale analysis) or GPU usage
If your use case requires more resources, longer runtimes or GPU, please reach out to request a custom setup.
Special Kernels and Environments
JupyterLab in EOxHub supports multiple custom kernels depending on your analysis needs. To learn how to install or request specific environments (e.g. for deep learning or domain-specific libraries), refer to the:
➡️ Conda Store Documentation section
QGIS
Supported EOxHub Workspaces provide QGIS as a dedicated JupyterLab profile. This allows users to explore, visualize, edit, and process geospatial data through a browser-based desktop interface.
QGIS can access the same Workspace storage as JupyterLab, making it possible to process data in a notebook and inspect or visualize the results interactively without downloading them locally.
Example Notebooks
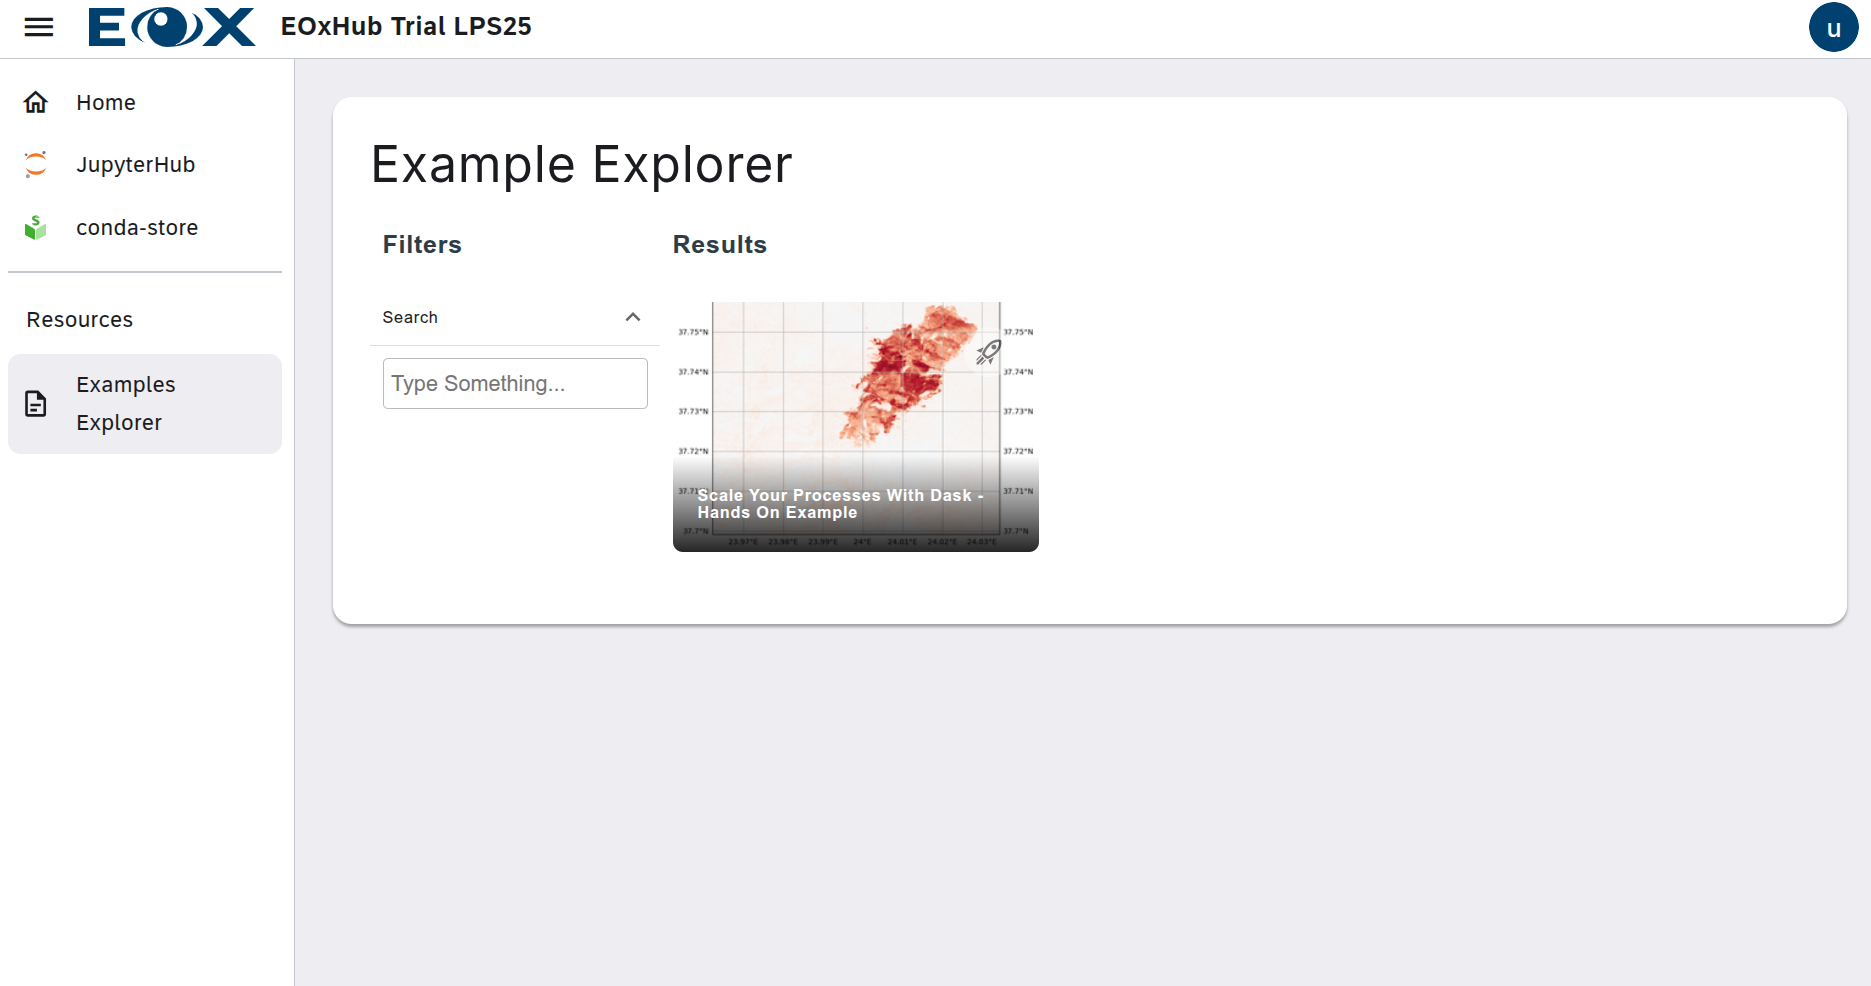
To get started quickly, navigate to the Examples Explorer section of the EOxHub Workspace. There, you’ll find:
Ready-to-run sample notebooks
Notebook tutorials on data access and visualization
Sample Workflows covering EO analysis
These notebooks are an excellent entry point to understand EOxHub Workspaces, JupyterLab options, accessing Earth Observation data, and more. Learn more about what you can explore and how to run them in your workspace in Example Notebooks
Scalable processing with Dask
Dask enables notebooks to distribute larger or parallel processing workloads across multiple workers.
Tracking machine-learning experiments
Notebooks can use MLflow to record experiment parameters, metrics, models, and other outputs.