The Publishing Dashboard provides a user-facing web interface for presenting and distributing curated datasets and narratives. It centers interactive maps and charts, as well as search and filter capabilities, and can be configured for public sharing or restricted access for defined user groups.
Daily operation does not require coding skills or deep technical knowledge: content and configuration are maintained via the Data Editor and Narrative Editor, other applications available inside the EOxHub workspace together with the dashboard.
The Publishing Dashboard is based on eodash, EOxElements and vitepress. It is a web client instance connected to the information managed in the Data Editor as well as the Narrative Editor.
Usually the Publishing Dashboard is configured for public access, as it is intended to proliferate information to a larger audience. If the intent is to provide data access to a managed user circle it is also possible to run the Publishing Dashboard within the EOxHub Workspace allowing only selected users access to the content. Multiple instances can be managed for different user groups within one workspace.
Inside the Dashboard section you can see the data configured in the Data Editor, as in the following Figure.
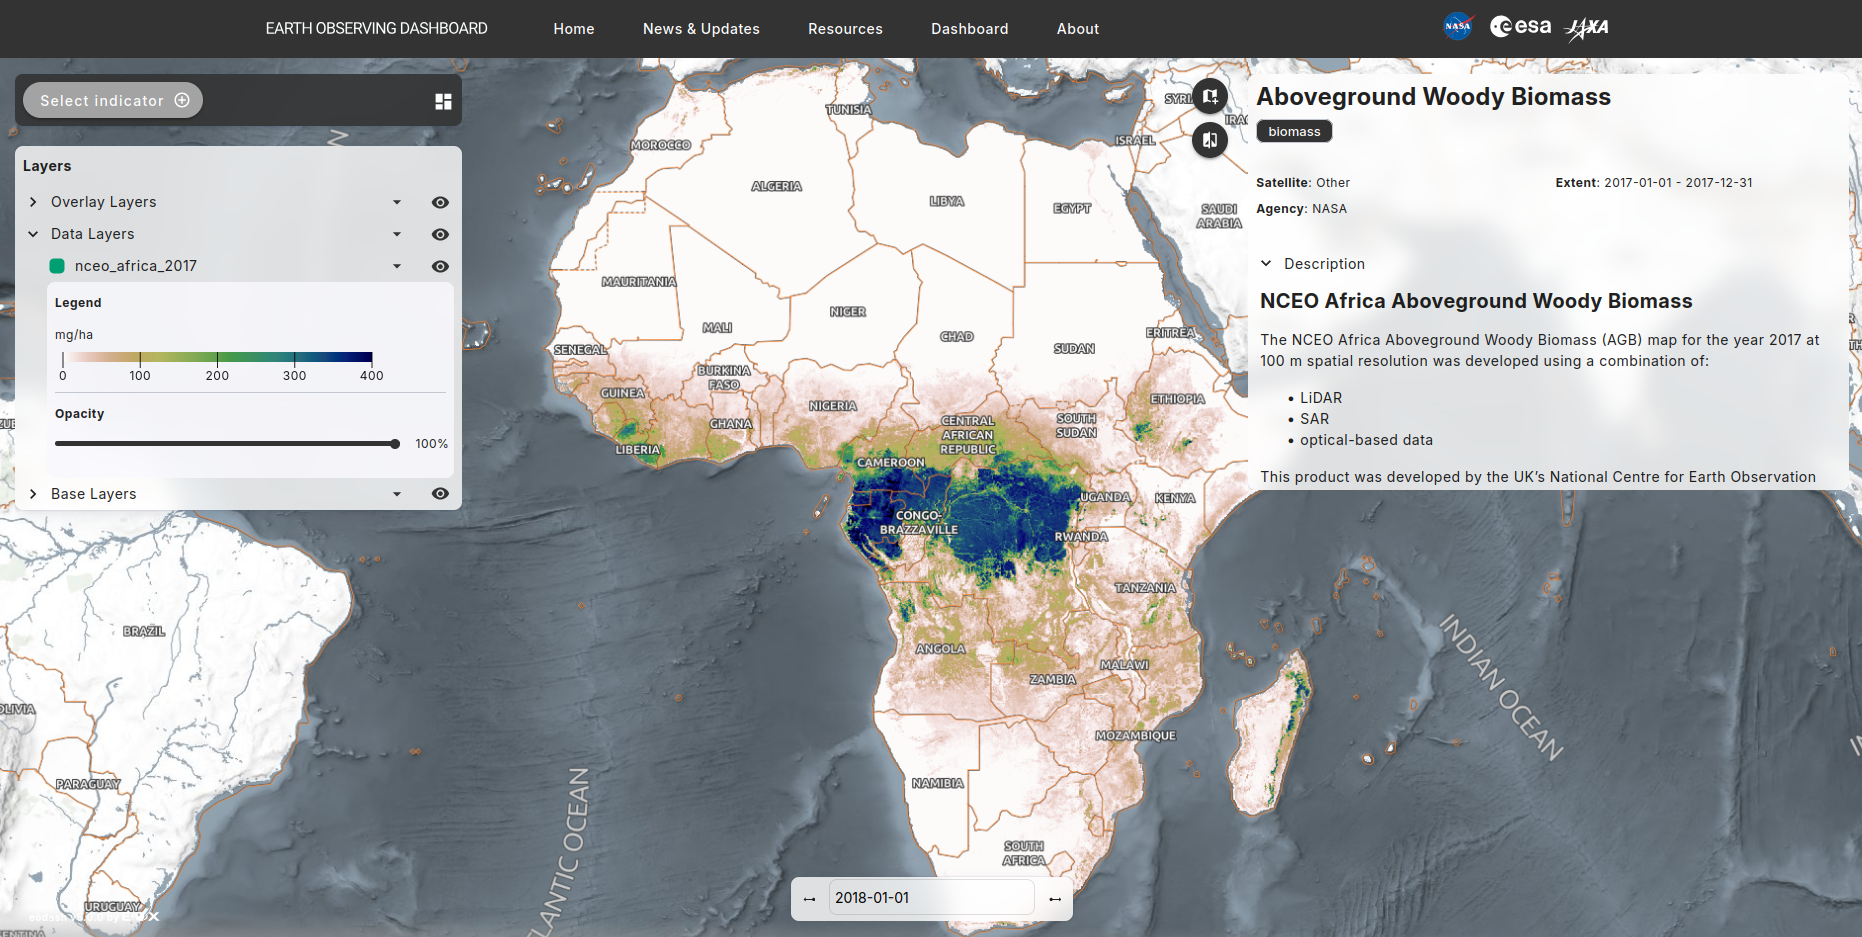
Figure 1:Dashboard screenshot from eodashboard.org
The created narratives can also be listed, searched and explored as soon as the content becomes available in the repository managed by the Narrative Editor.
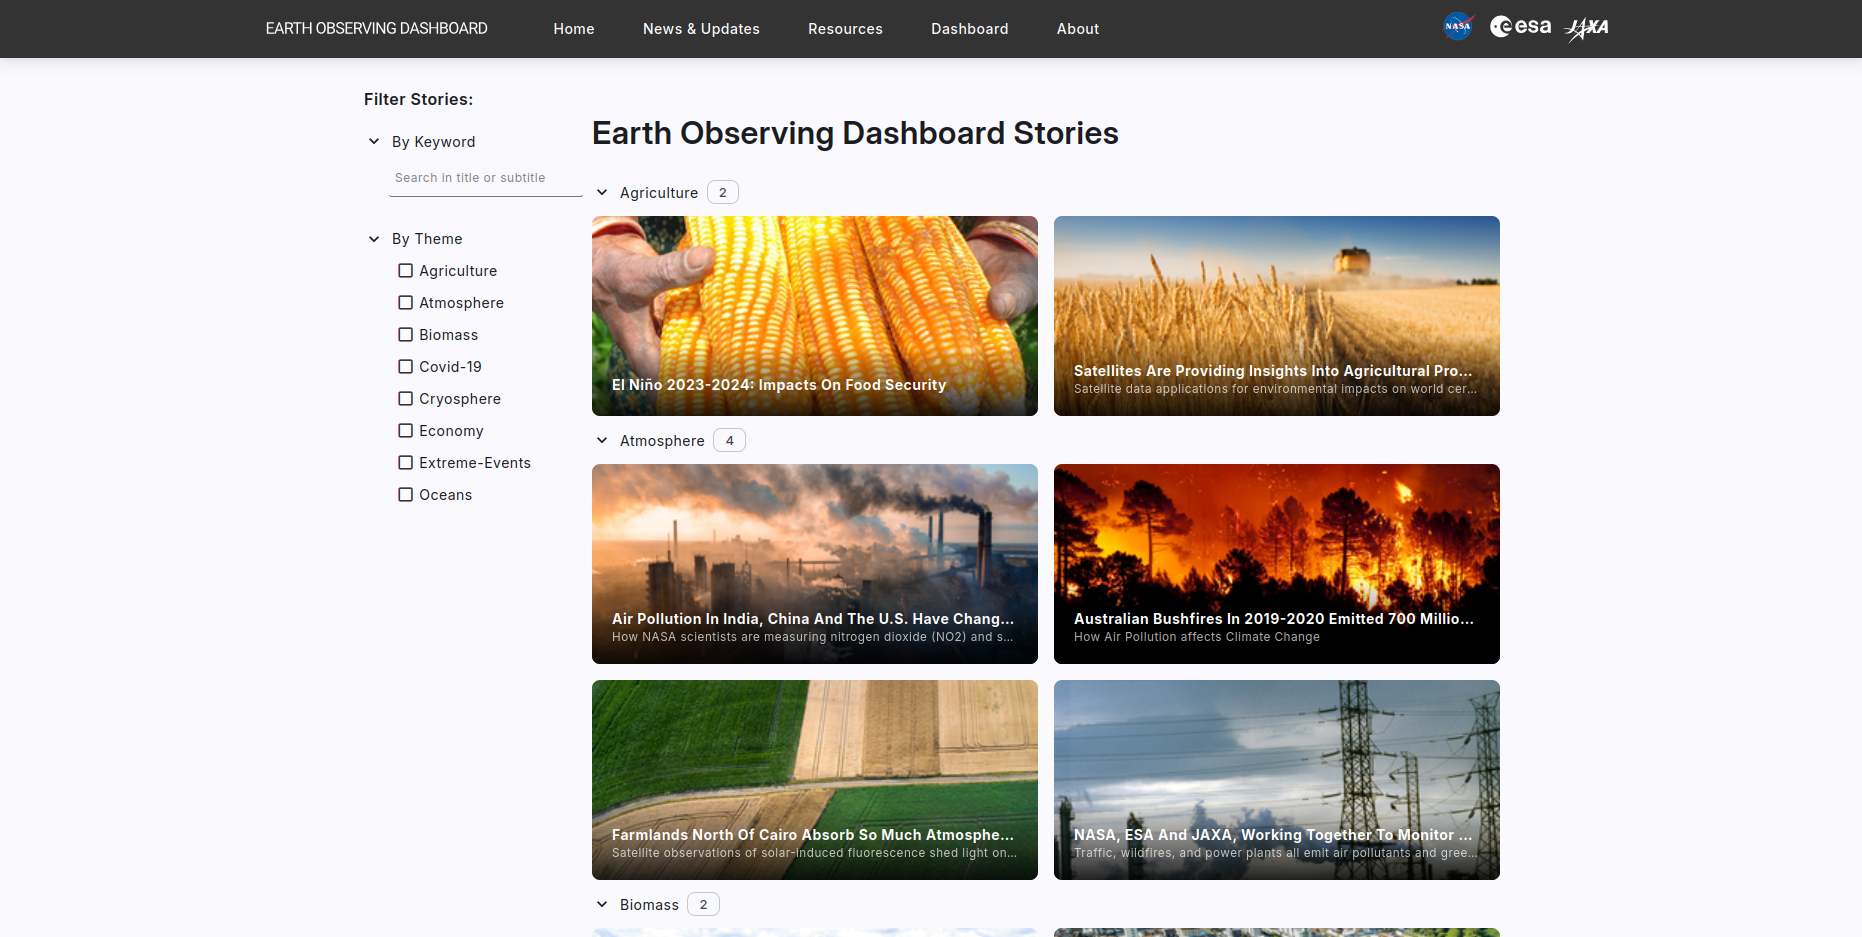
Figure 2:Narratives overview screenshot from eodashboard.org
For more information on how to manage the published data content please have a look at the Data Editor section, or for managing narratives at the Narrative Editor section.